Top 10 Key performance Indicators for Mineral Processing Plants
Trending
Here are the **Top 10 Key Performance Indicators (KPIs)** for mineral processing plants.These KPIs provide a balanced view of operational efficiency, product quality, cost control, and sustainability:
--- ### 1. **Plant Throughput (tons/hour or tons/day)**
* **Definition**: The total mass of ore processed by the plant over a specific period.
* **Why It Matters**: Directly tied to revenue generation. Higher throughput generally means higher production—assuming recovery and grade are maintained.
--- ### 2. **Recovery Rate (%)**
* **Definition**: The percentage of valuable mineral recovered from the ore relative to the theoretical amount.
* **Why It Matters**: A primary indicator of process efficiency. Low recovery implies loss of valuable material and revenue.
--- ### 3. **Product Grade (%)**
* **Definition**: The concentration of valuable mineral in the final product.
* **Why It Matters**: Impacts product quality and price. Higher grade often means better market value and processing profitability.
--- ### 4. **Overall Equipment Effectiveness (OEE) (%)**
* **Definition**: Combines equipment availability, performance efficiency, and quality rate.
* **Why It Matters**:
Provides a comprehensive measure of how well plant assets are utilized.
--- ### 5. **Energy Consumption per Ton (kWh/ton)**
* **Definition**: The amount of energy used to process one ton of ore.
* **Why It Matters**: A key cost driver and sustainability metric. Helps identify opportunities for process or equipment optimization.
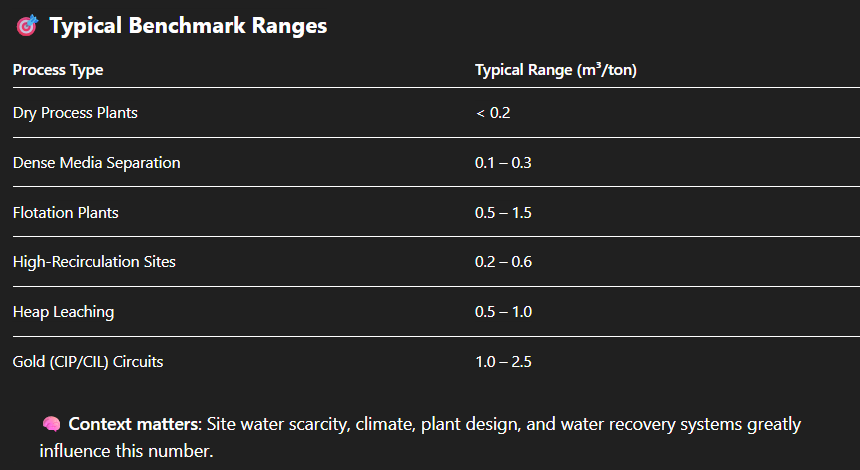
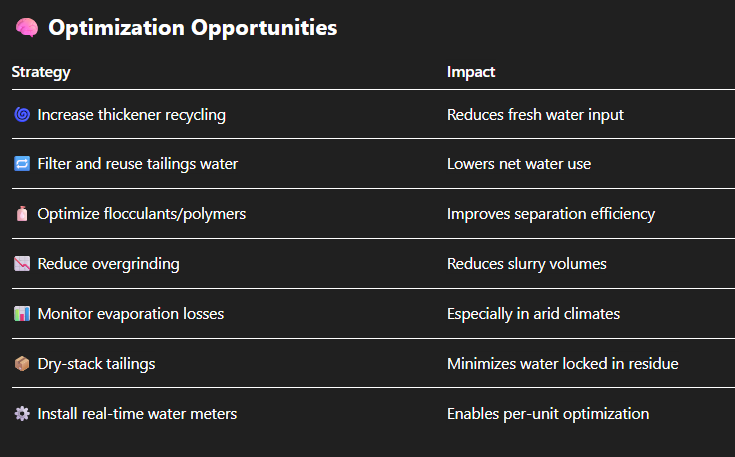
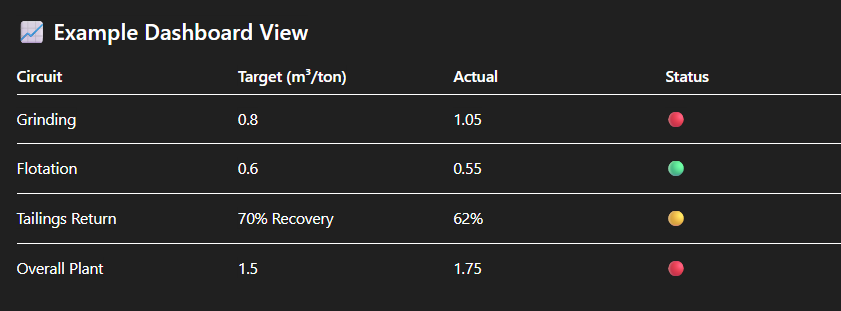
--- ### 6. **Water Consumption per Ton (m³/ton)**
* **Definition**: The volume of water used per ton of ore processed.
* **Why It Matters**: Crucial in areas with water scarcity and for ESG compliance.
--- ### 7. **Reagent Consumption per Ton (kg/ton)**
* **Definition**: Amount of flotation reagents, pH modifiers, flocculants, etc., used per ton of ore.
* **Why It Matters**:
Significant cost contributor and affects downstream processing and tailings management.
--- ### 8. **Tailings Grade (%)**
* **Definition**: The concentration of valuable mineral remaining in the tailings.
* **Why It Matters**: Inversely related to recovery—high tailings grade usually indicates inefficient recovery.
--- ### 9. **Unscheduled Downtime (hours/month)**
* **Definition**: Time lost due to unplanned equipment or process failures.
* **Why It Matters**: Impacts throughput and cost. High downtime signals poor maintenance or reliability issues.
--- ### 10. **Cost per Ton Processed (\$/ton)**
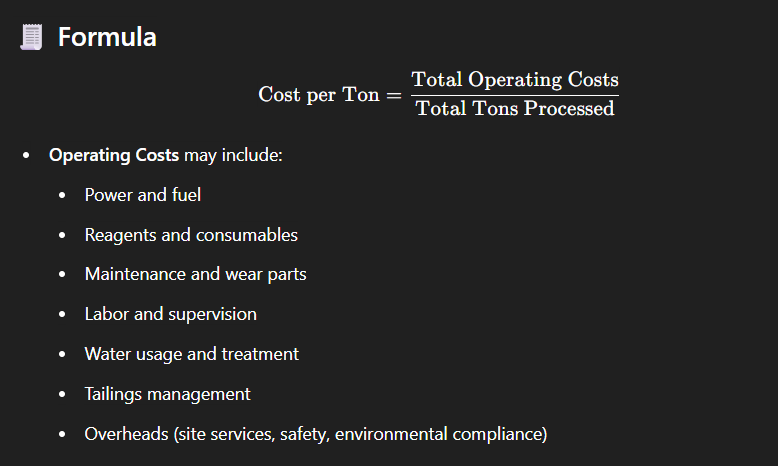
* **Definition**: Total operational cost divided by tons processed.
* **Why It Matters**: Reflects overall process efficiency and profitability. Allows benchmarking across operations or time periods.
Break Down By Process Unit
---
## 
---
## 
---
## 
---
## 
---
## 
---
## 

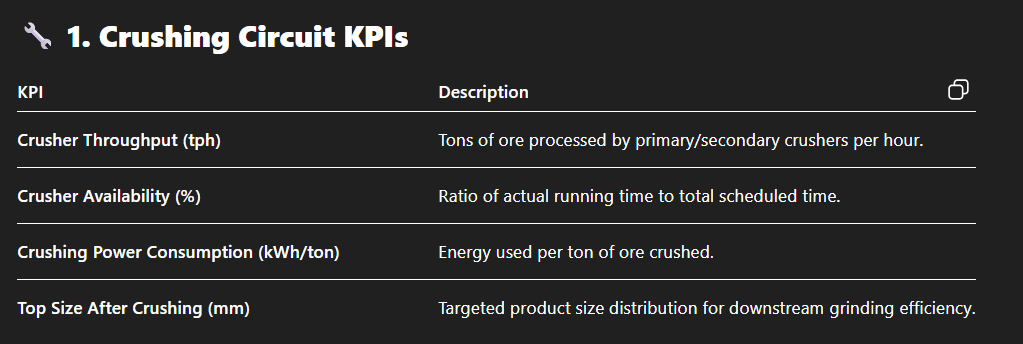
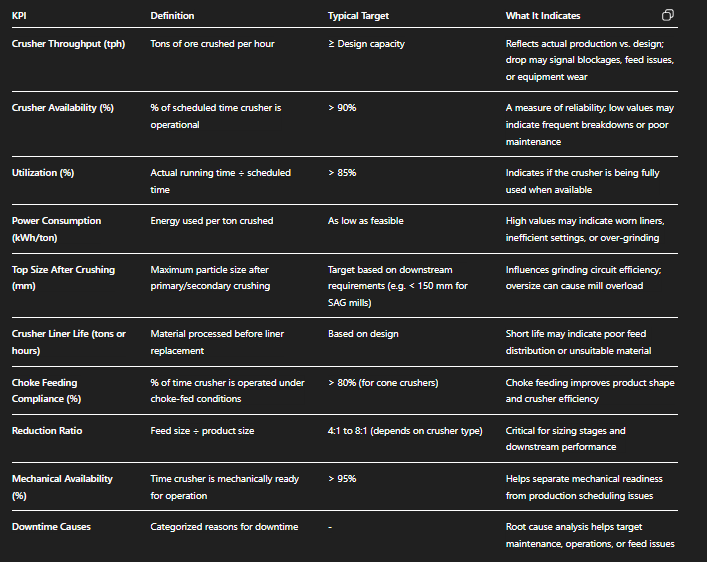
Crushing Circuit KPI's
 **Crushing Circuit KPIs**
---
### 
* Crushing KPIs should be **monitored in real-time** via SCADA or historian systems and reviewed daily in shift reports.
* Performance benchmarking across multiple shifts or units can highlight **training gaps or operator variation**.
* Pairing these KPIs with **vibration, load, and wear sensor data** can improve predictive maintenance planning.
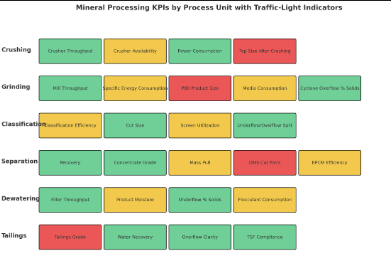
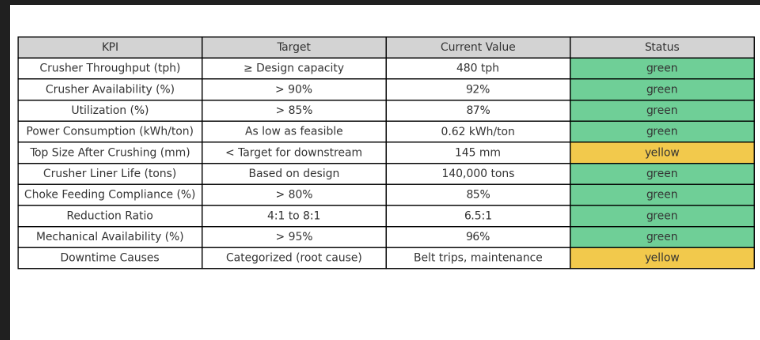
Crushing Circuit DashBoard
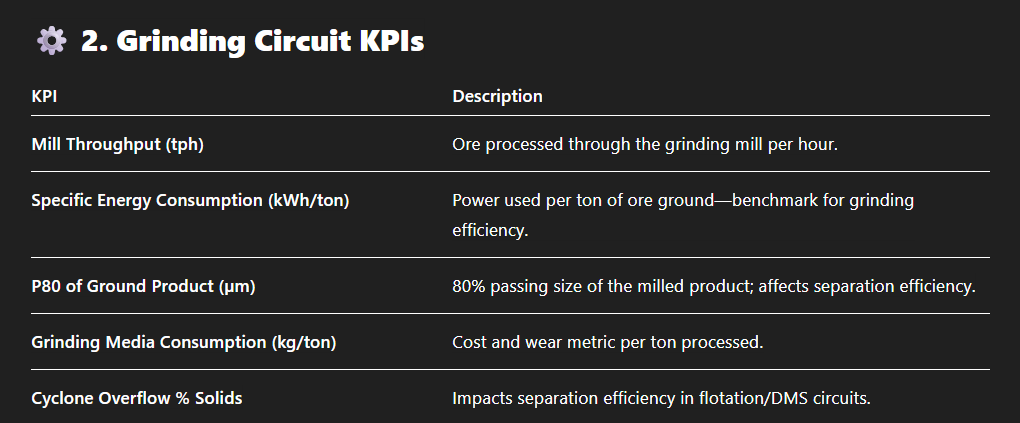
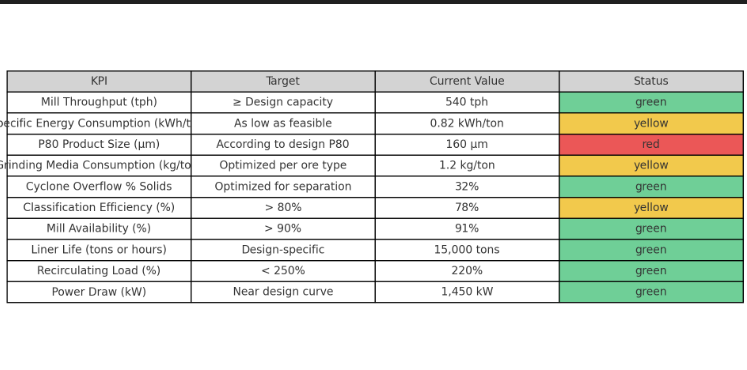
Grinding circuit KPI Dashboard
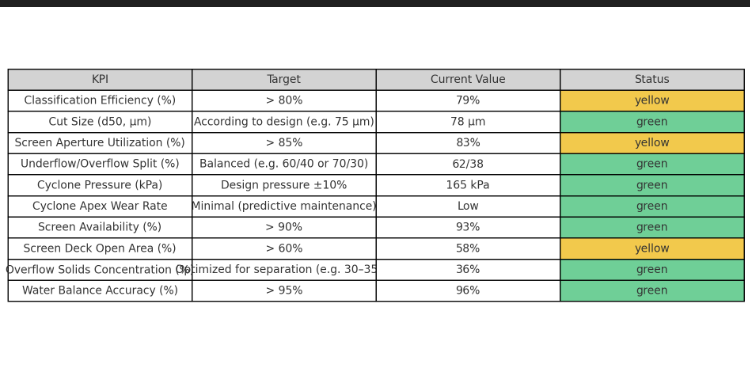
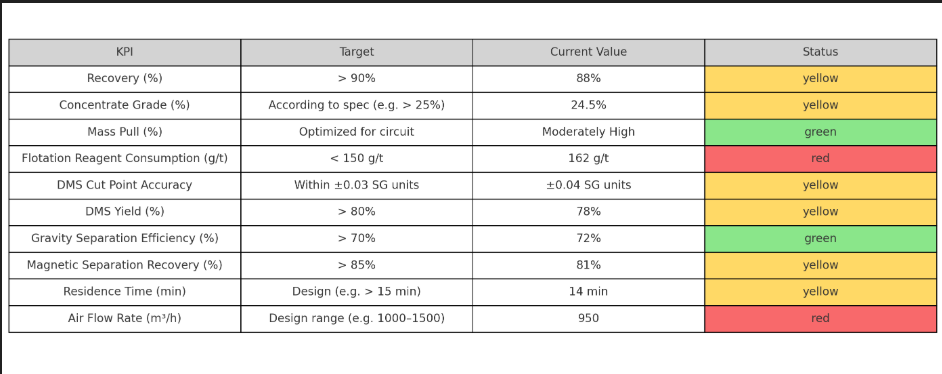
 **Green** = On Target
*
  **Yellow** = Requires Attention
*
  **Red** = Critical / Needs Immediate Action
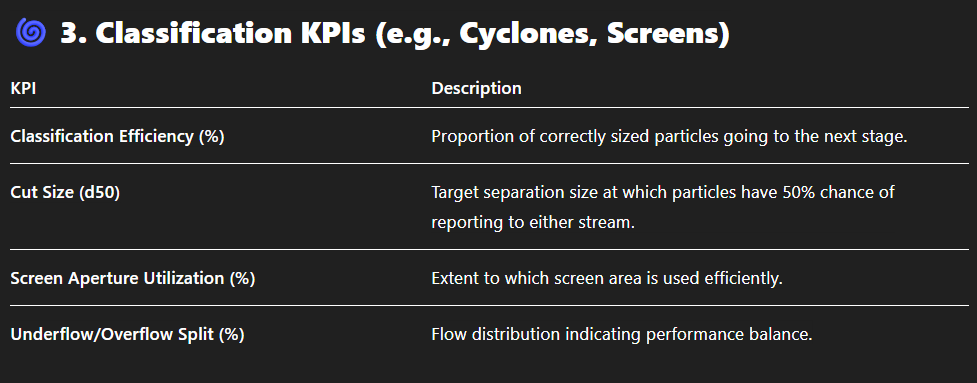
Classification circuit KPI Dashboard
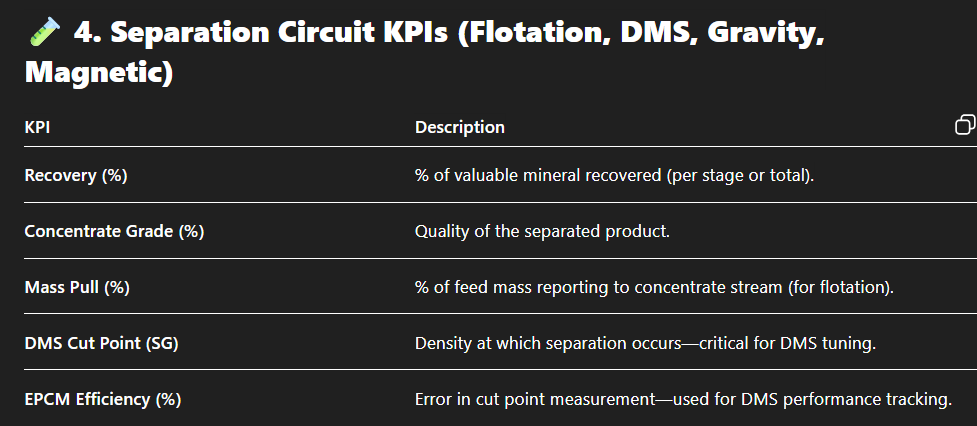
Separation circuit KPI dashboard
### 
* **Mass Pull (%)**
* **Gravity Separation Efficiency (%)**
### 
* **Recovery (%)**
* **Concentrate Grade (%)**
* **DMS Cut Point Accuracy**
* **DMS Yield (%)**
* **Magnetic Separation Recovery (%)**
* **Residence Time (min)**
### 
* **Flotation Reagent Consumption (162 g/t vs < 150 g/t)**
* **Air Flow Rate (950 m³/h vs min 1000)**
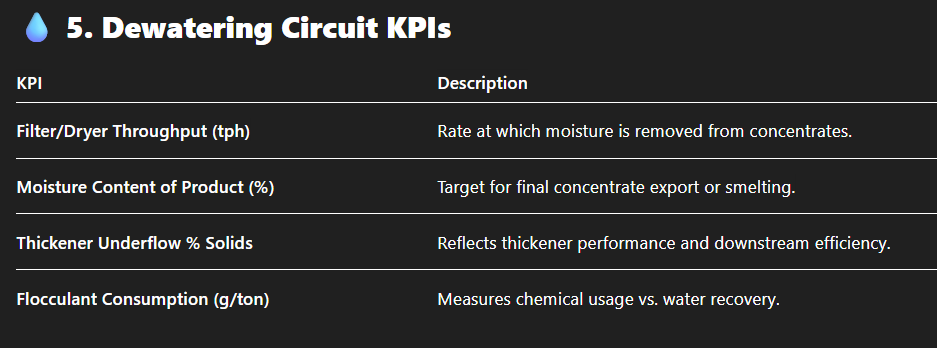
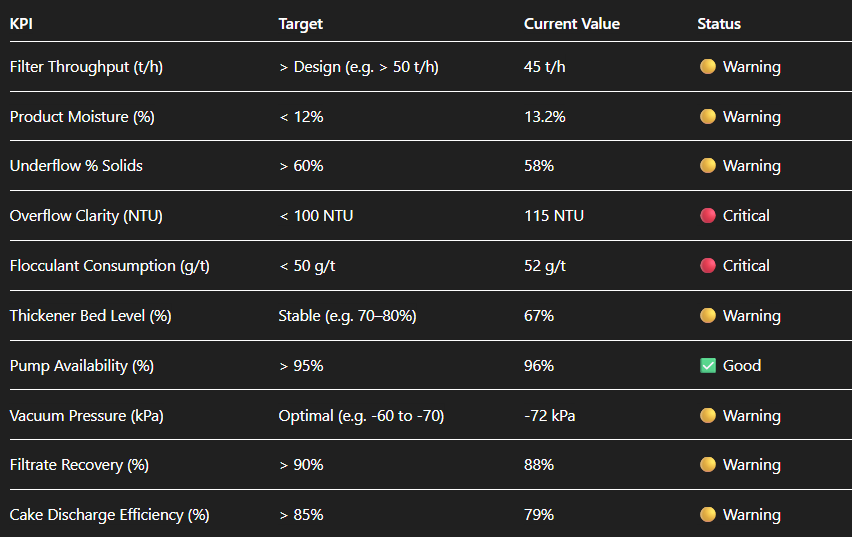
Dewatering Circuit KPI
---
### 
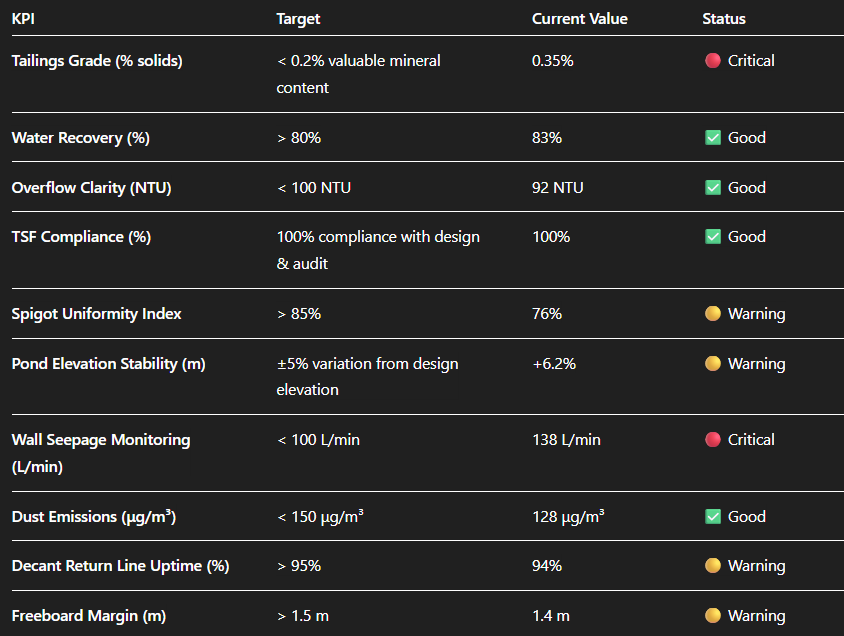
Tailings Management KPI
---
### 
---
### 
* 
* 
* 
Plant Throughput KPI
 **Plant Throughput KPI
– Overview** **KPI Name**:
**Plant Throughput**
**Units**: Tons per hour (tph) or tons per day (tpd)
**Category**: Global/Production KPI
**Applies To**: Entire plant — sum of all circuits (Crushing → Tailings)
---
### 
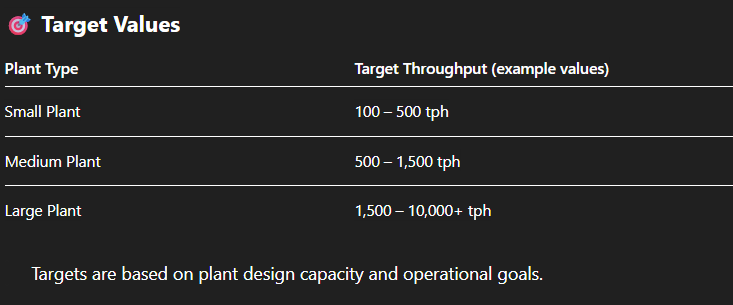
**Plant Throughput** measures the total mass of ore processed through the plant per unit of time.
* **tph (tons/hour)** is used for hourly/daily tracking.
* **tpd (tons/day)** is used for daily/weekly/monthly reporting.
---
### 
---
### 
* Directly tied to **production revenue**.
* Affects downstream circuit **loading**, **energy consumption**, and **recovery rates**.
* Helps identify **bottlenecks**, **downtime impacts**, or **ore variability** effects.
---
### 

---
### 
* Track **rolling hourly averages** for real-time control.
* Integrate with **downtime reporting** and **maintenance logs**.
* Use as a leading indicator for **grinding media consumption**, **recovery rate**, and **tailings volume**.
Recovery Rate %
 **Recovery Rate (%) – KPI Overview**
**KPI Name**: **Recovery Rate**
**Units**: Percent (%)
**Category**: Metallurgical Efficiency
**Applies To**: Separation circuits — Flotation, DMS, Gravity, Magnetic, etc.
---
### 
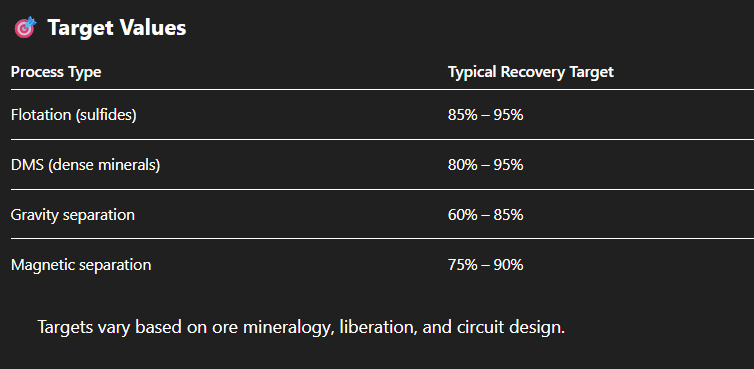
**Recovery Rate** measures the proportion of valuable mineral recovered from the feed relative to the theoretical amount present.

---
### 
---
### 
* Direct measure of **how effectively valuable minerals are extracted**.
* Higher recovery → **less metal lost to tailings**, **more saleable product**.
* Low recovery = revenue loss and potential metallurgical or operational issues.
---
### 

---
### 
* **Ore mineralogy and liberation**
* **Grind size and classification**
* **Residence time and mixing**
* **Reagent type and dosage**
* **Operator practices and circuit stability**
---
### 

Product Grade %
 **Product Grade (%) – KPI Overview**
**KPI Name**: **Product Grade**
**Units**: Percent (%)
**Category**: Product Quality
**Applies To**: Final concentrate or intermediate product from flotation, DMS, magnetic, or gravity circuits.
---
### 
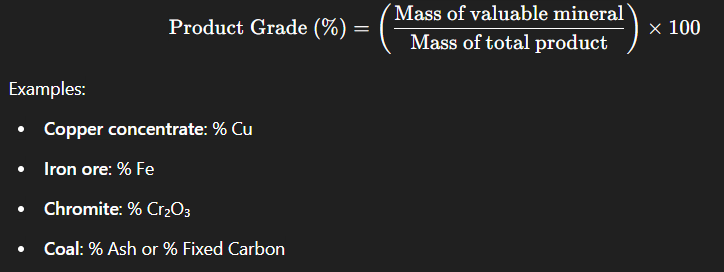
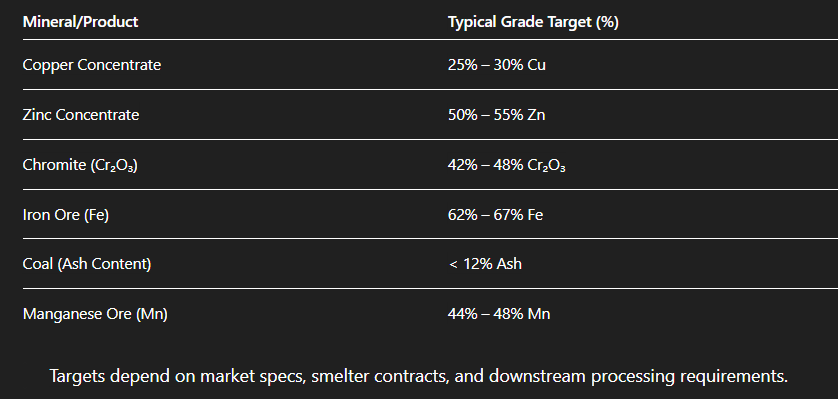
**Product Grade** refers to the **concentration of valuable mineral (metal or compound)** in the final product.
---
### 
---
### 

---
### 
* Determines **market value and saleability**.
* Impacts **smelter treatment charges (TC/RC)** or penalties.
* Affects **logistics costs** per unit metal.
* Drives **mass pull and recovery trade-offs** in separation circuits.
---
### 
* **Higher Grade = Lower Mass Pull = Lower Recovery** (and vice versa).
* Optimal point is based on **net smelter return (NSR)** or **cost-per-unit metal recovered**.
---
### 

Overall Equipment effectiveness
 **Overall Equipment Effectiveness (OEE) – KPI Overview**
*
**Overall Equipment Effectiveness (OEE) – KPI Overview**
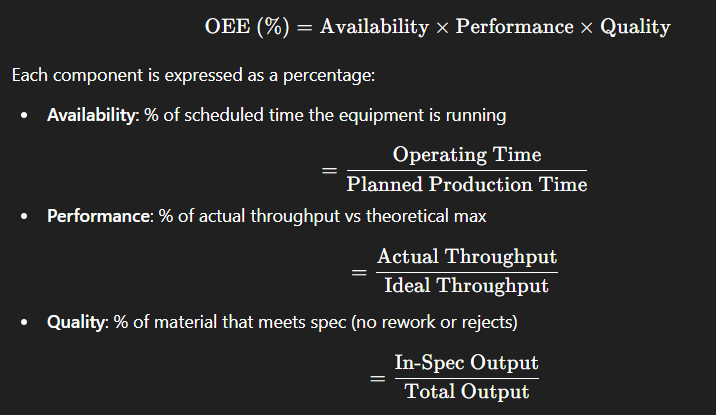
**KPI Name**: **Overall Equipment Effectiveness (OEE)**
**Units**: Percent (%)
**Category**: Equipment Efficiency
**Applies To**: Any major production asset — crushers, mills, screens, thickeners, conveyors, etc.
---
### 
---
### 

---
### 
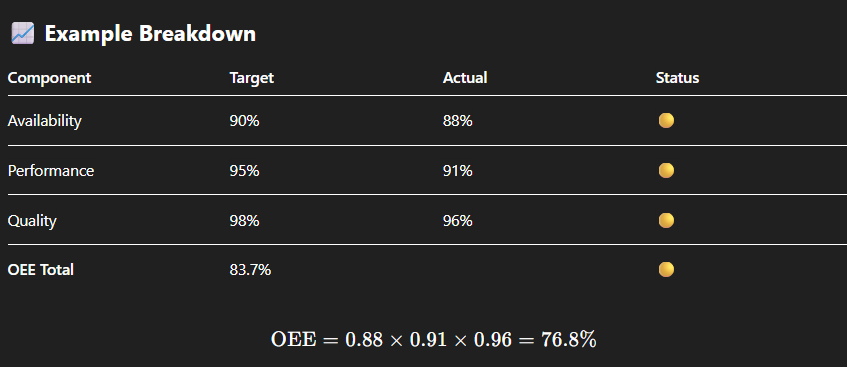
---
### 
* Identifies **hidden production losses**.
* Drives **maintenance and reliability improvements**.
* Links operations with **plant uptime, speed, and product quality**.
* Can be tracked per **machine**, **process unit**, or **plant-wide**.
---
### 
* Use OEE dashboards in real-time on operator HMIs.
* Integrate OEE tracking with **downtime logging systems**.
* Review OEE weekly to detect trends in **wear, maintenance, or operator efficiency**.
Why Equipment Effectveness Matters
 **Why OEE Matters in Mineral Processing Plants**
**Overall Equipment Effectiveness (OEE)** is not just a number — it's a powerful lens to view and improve plant performance.
Here's why it’s crucial in a mineral processing context:
---
### 1. 
* **Availability losses** (e.g., breakdowns, planned downtime)
* **Performance losses** (e.g., slow cycles, underfeeding)
* **Quality losses** (e.g., off-spec product, rework) This makes invisible inefficiencies **visible**, helping pinpoint where and why you're losing production time or value.
---
### 2. 
* Better **preventive maintenance planning** * Early detection of equipment degradation
* Prioritization of high-impact maintenance tasks This reduces emergency repairs and improves **asset reliability**.
---
### 3. 
* Improving a crusher’s performance from 80% to 90% could equate to **hundreds of additional tons per day**, without adding new equipment. Thus, OEE enables **"sweating the assets"** — getting more from what you already own.
---
### 4. 
* **Operators** focus on runtime, feed rate, and material specs.
* **Maintenance teams** focus on minimizing downtime.
* **Plant managers** focus on maximizing revenue-generating output. Everyone speaks the same language — productivity. This fosters a **data-driven improvement culture**.
---
### 5. 
* **Live dashboards** with traffic-light indicators
* **Automated alerts** when thresholds are breached * **Shift-based or daily performance reviews** This enhances **agility** in operations and continuous improvement.
---
### 
Energy Consumption per ton
 **Energy Consumption per Ton – KPI Overview**
**KPI Name**: **Energy Consumption per Ton**
**Units**: Kilowatt-hours per ton (kWh/ton)
**Category**: Operational Efficiency / Cost Control
**Applies To**: All circuits — especially energy-intensive units like **crushing**, **grinding**, **pumping**, **flotation**, **dewatering**, etc.
---
### 
---
### 
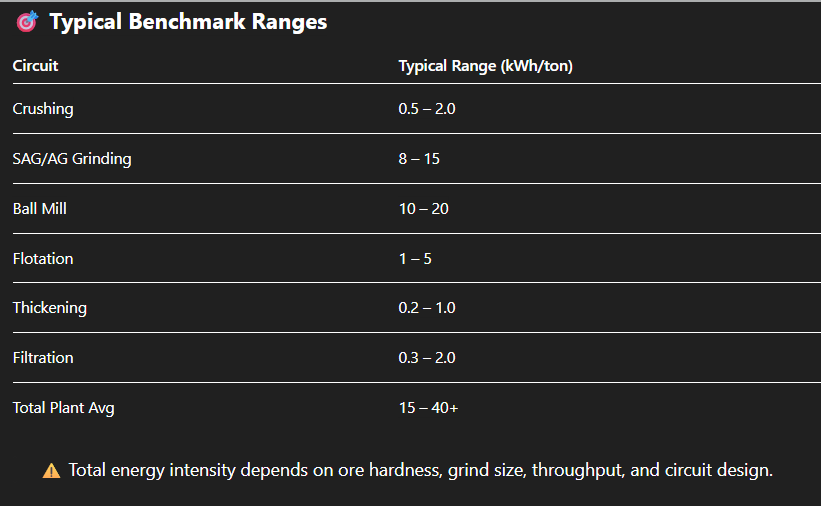
---
### 

---
### 
* **Electricity is one of the largest OPEX items** in mineral processing.
* High energy consumption **increases cost per ton** and **carbon footprint**.
* Early signs of **grinding inefficiency**, **liner/media wear**, or **pumping losses** often show up in this KPI.
---
### 
* Ore sorting or pre-concentration to reduce tonnage to grind.
* Maintain optimal **grind size** and avoid overgrinding.
* Real-time mill load control using **mill power vs tonnage plots**.
* Replace inefficient motors, drives, or pumps.
* Implement **variable frequency drives (VFDs)** on fans and pumps.
---
### 
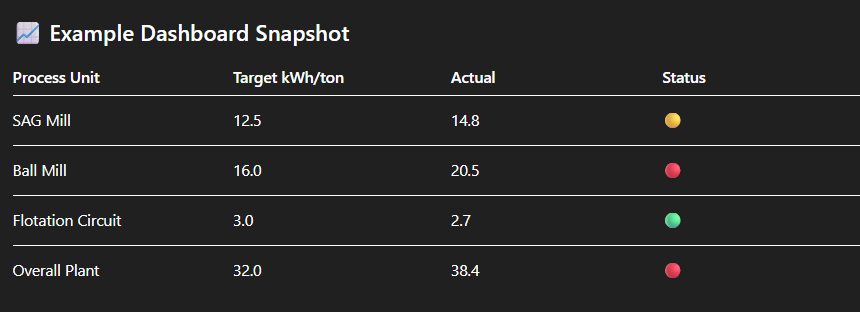
Optimiation opportunities for energy consumption
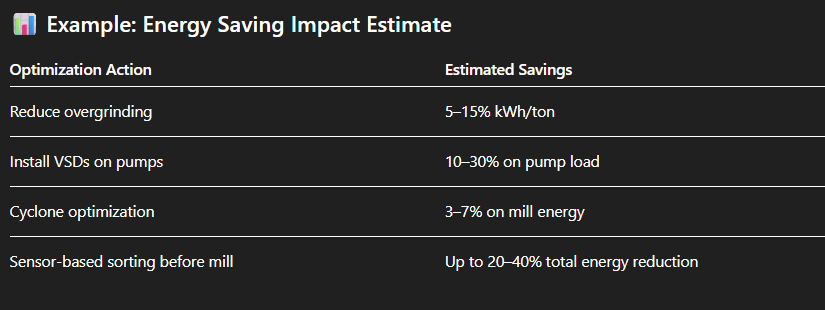
 **Optimization Opportunities for Energy Consumption per Ton (kWh/ton)**
Reducing energy consumption per ton is one of the most effective ways to improve **profitability**, **plant efficiency**, and **sustainability**. Below are key opportunities organized by **process area** and **strategy type**:
---
### 
#### 
* 
* 
* 
* 
* 
* 
---
### 
#### 
* 
* 
* 
---
### 
#### 
* 
* 
* 
---
### 
#### 
* 
* 
* 
---
### 
#### 
* 
* 
* 
* 
---
### 
Water consumption per ton
 **Water Consumption per Ton (m³/ton) – KPI Overview**
**KPI Name**: **Water Consumption per Ton**
**Units**: Cubic meters per ton (m³/ton)
**Category**: Sustainability / Resource Efficiency / ESG
**Applies To**: All circuits – especially **crushing**, **grinding**, **classification**, **flotation**, **tailings**, and **dust suppression**
---
### 

---
### 
---
### 

---
### 
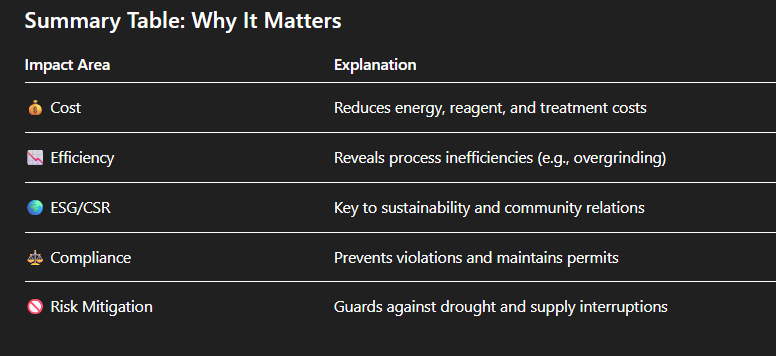
* **Cost**: Pumping, storing, and treating water increases OPEX.
* **Sustainability**: Lower water use = stronger ESG performance.
* **Regulatory compliance**: Limits on groundwater use, discharge, and contamination are tightening.
* **Risk reduction**: High water demand is a liability in drought-prone regions.
---
### 
---
### 
Why Water consumption per ton matters
 **Why Water Consumption per Ton Matters in Mineral Processing**
Water is a critical but increasingly **scarce and costly** resource in mining and mineral processing.
Managing **water consumption per ton** of ore processed is not just an environmental issue — it's directly tied to **profitability**, **compliance**, and **long-term operational stability**.
---
### 
* **Pumping, treatment, and storage** of water consume significant energy and chemicals — increasing **OPEX**.
* Excessive water use often indicates **inefficiencies**, such as:
* Overgrinding (slurry volume too high)
* Inefficient thickening/filtration
* Water leaks or poor recovery from tailings
* **Optimizing water use** per ton processed directly improves **unit costs**.
---
### 
* Water is a **shared and sensitive resource**, especially in arid regions.
* Communities, agriculture, and ecosystems compete for the same water. * High water use impacts a mine’s:
* **Social license to operate**
* ESG scores (for investors)
* Exposure to **reputation and litigation risk**
> 
---
### 
* Governments are tightening restrictions on:
* **Water abstraction**
* **Effluent discharge**
* **Return water quality**
* Mines are under increasing pressure to:
* Demonstrate **water efficiency**
* Submit **annual water balance reports**
* Achieve **zero liquid discharge (ZLD)** or near-zero loss systems
---
### 
* In dry regions, water supply disruptions can **halt production**.
* Sites with poor water planning may:
* Lose **access to water licenses**
* Face **fines or shutdowns**
* Require **costly desalination or trucking**
---
### 
* Water consumption per ton is a **universal KPI** across operations.
* Enables:
* Internal benchmarking across units or shifts
* External benchmarking across industry peers
* Pinpointing high-usage units for **targeted savings**
--- ### Summary Table: Why It Matters
Water consmption Optimization Opportunities
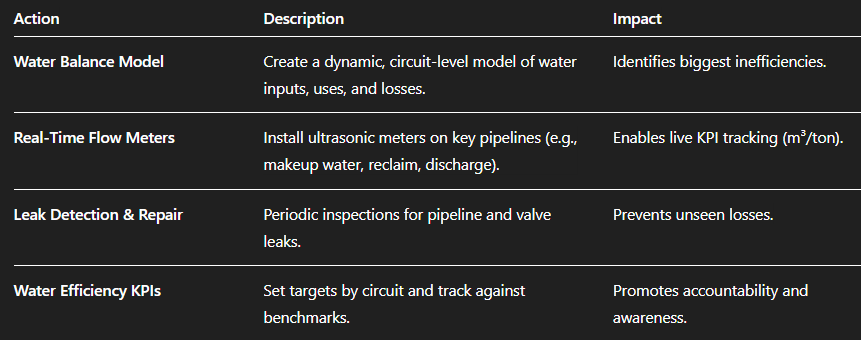
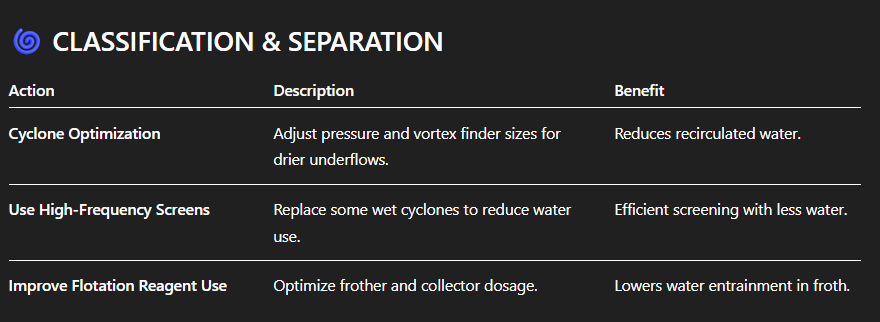
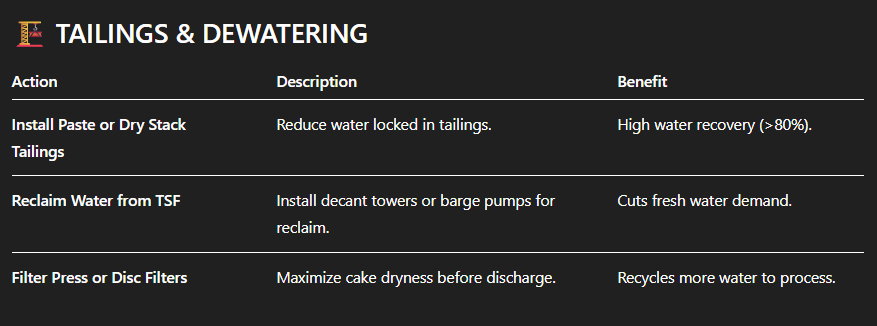
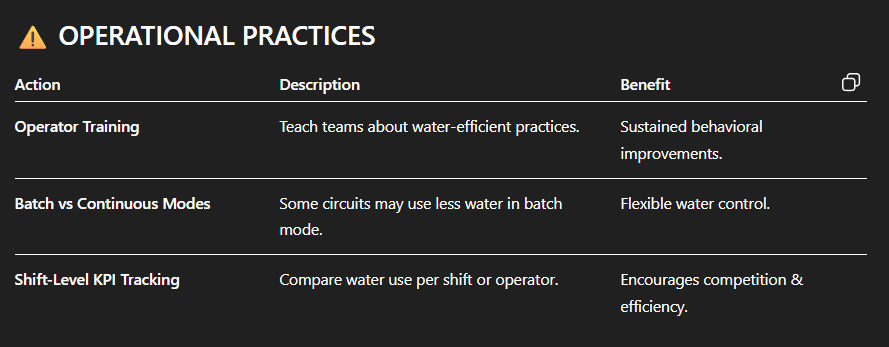
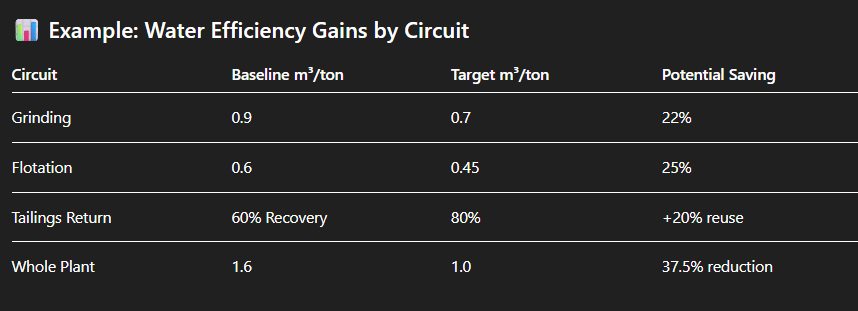
 **Water Consumption Optimization Opportunities in Mineral Processing**
Optimizing water use is not just about conservation — it's a **strategic move** to reduce operating costs, improve ESG performance, and ensure long-term water security. Below is a breakdown of actionable water-saving strategies, organized by **process area** and **optimization type**.
---
## 
---
## 

---
## 
---
## 
---
## 

---
## 
---
### 
---
### 
* **AI-driven water balance simulators**
* **Machine learning models** to predict optimal thickener dosing
* **Digital twin dashboards** for real-time water tracking
* **Automated thickener rake control** for optimal underflow solids
Reagent consumption per ton
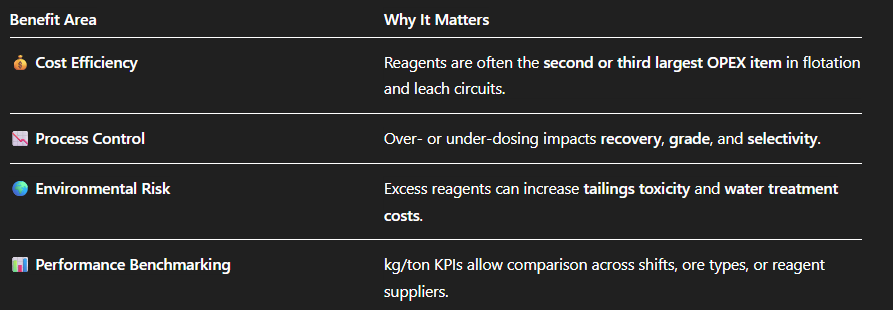
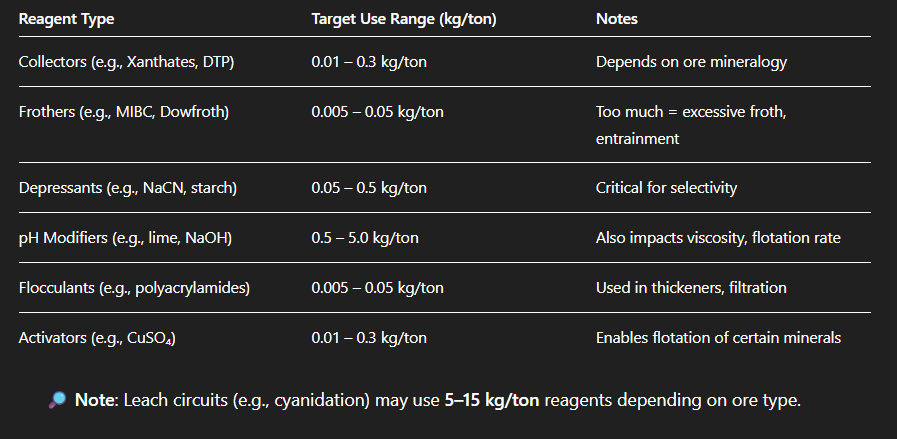
 **Reagent Consumption per Ton (kg/ton)** in Mineral Processing
**Reagents** (collectors, frothers, flocculants, depressants, activators, etc.) are essential to mineral sepa
ration processes — especially flotation, leaching, and thickening. Tracking **reagent consumption per ton** of ore is vital for **cost control**, **process optimization**, and **environmental compliance**.
---
### 
---
### 
---
### 
* High reagent consumption with **no improvement in recovery or grade**
* Visible **froth instability**, excessive entrainment or collapses
* **Foaming in thickeners** or **sludge in filters**
* Frequent **pH swings** or **inconsistent tails assays** * High **reagent variability across shifts or ore blends**
---
### 
---
### 
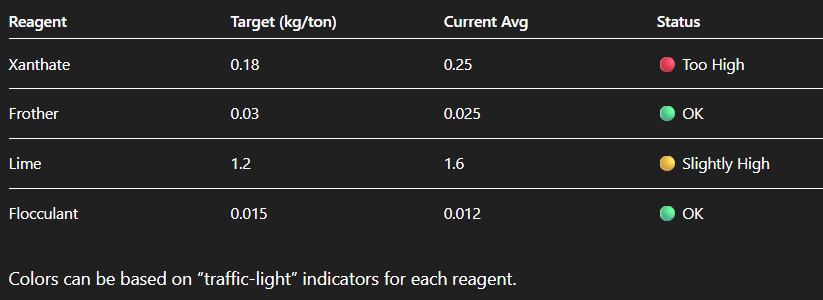
Reagent KPI Dashboard Concept
Signs of Insufficient Usage
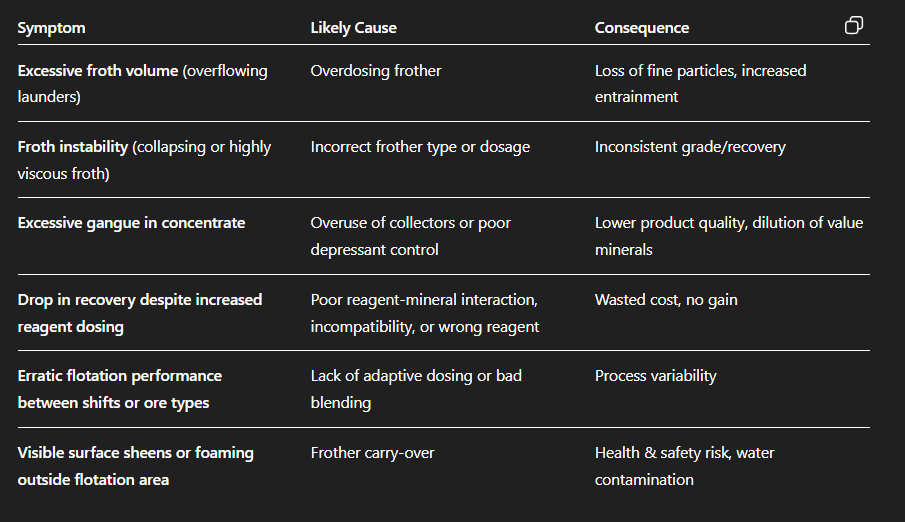
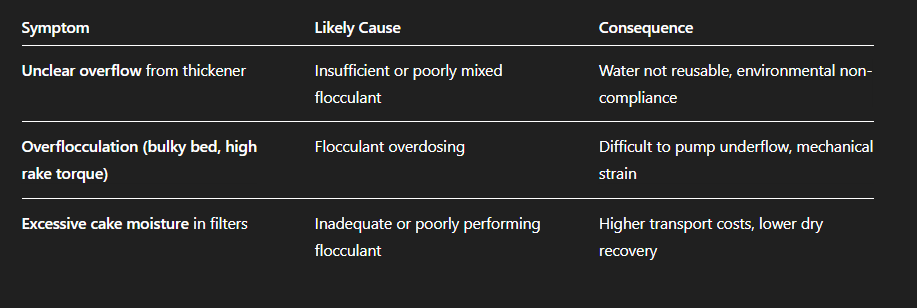
 **Signs of Inefficient Reagent Usage in Mineral Processing**
Inefficient reagent use not only drives up operating costs, but also leads to suboptimal recovery, poor concentrate quality, unstable process performance, and increased environmental liability. Below are key **symptoms and warning signs**, broken down by area of the plant.
---
## 
---
## 
---
## 

---
## 

---
## 

---
### 
* **Trend charts**:
Correlate reagent dose vs recovery and grade over time.
* **Mass balance reconciliation**:
Track reagent addition vs concentrate produced.
* **Online cameras**:
Froth behavior, tailings clarity.
* **Lab tests**: Bench-scale reagent optimization for new ore types.
Reagent Usage Optimization opportunities
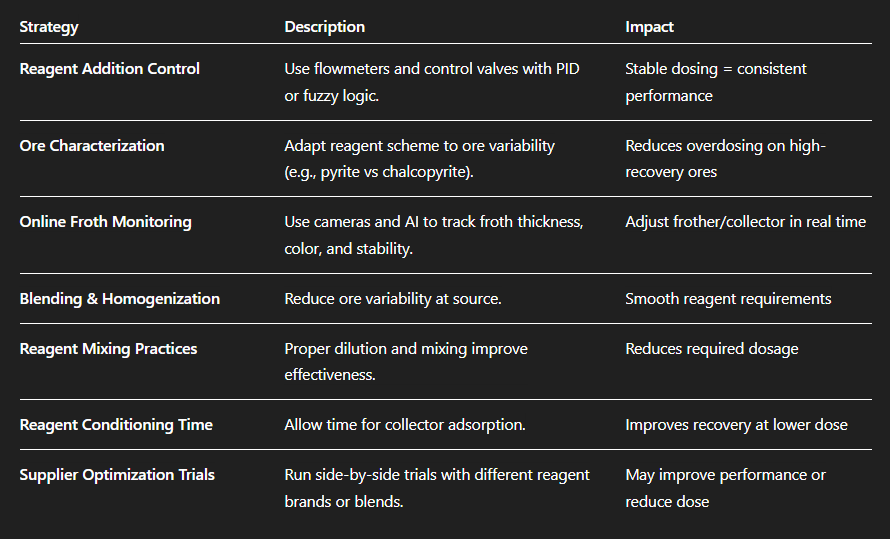
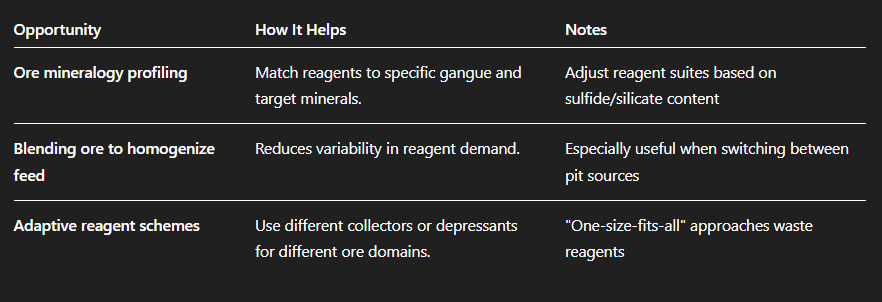
 **Optimization Opportunities: Reagent Usage in Mineral Processing**
Optimizing reagent usage is one of the **highest-impact cost-saving levers** in mineral processing plants.
It improves not only **economic performance** but also **process stability**, **product quality**, and **environmental compliance**.
Here’s a comprehensive breakdown of **reagent optimization strategies**, categorized by method:
---
## 

---
## 
---
## 

---
## 

---
## 

---
## 

---
### 

Tailings Grade (%)
 **Tailings Grade (%) – KPI Overview**
**KPI Name**: **Tailings Grade**
**Units**: Percentage (%) of target metal in tailings
**Category**: Recovery and Loss Control KPI
**Applies To**: Final tailings stream (after flotation, gravity, DMS, magnetic separation, etc.)
---
### 
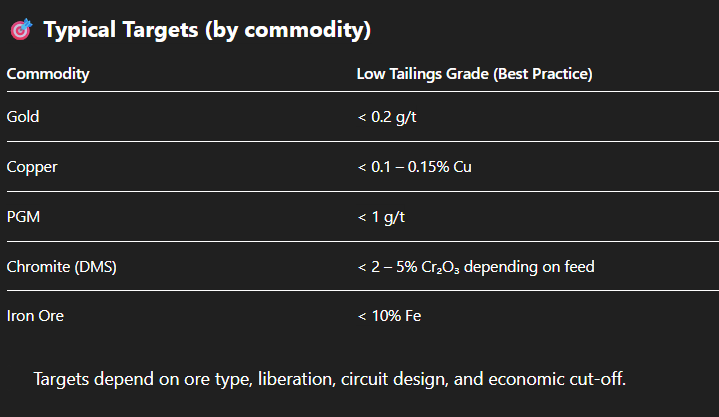
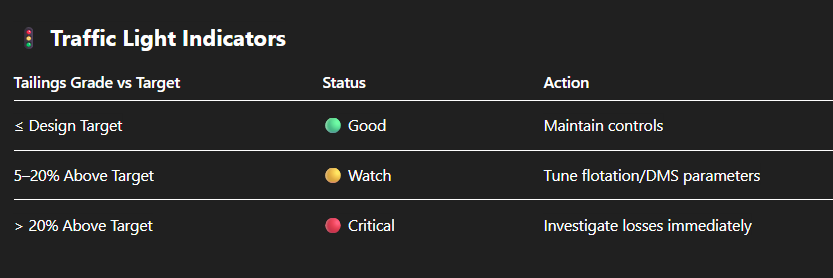
**Tailings Grade** measures the concentration of valuable metal **remaining in the tailings** after all processing steps. It is a **direct indicator of metal loss** and the effectiveness of the recovery circuits.
For example:
* In a gold plant: tailings grade = grams of Au per ton of tailings * In a copper concentrator: tailings grade = % Cu in final tailings
---
### 
---
### 
---
### 
* **Direct measure of recovery loss** → High tailings grade = lost revenue
* **Indicates process underperformance** → Especially in rougher/cleaner stages
* **Impacts downstream tailings reprocessing potential**
* **Key input for metallurgical accounting and balance closure**
* **Drives economic decision on whether regrind, scavenger, or reprocessing is viable**
---
### 
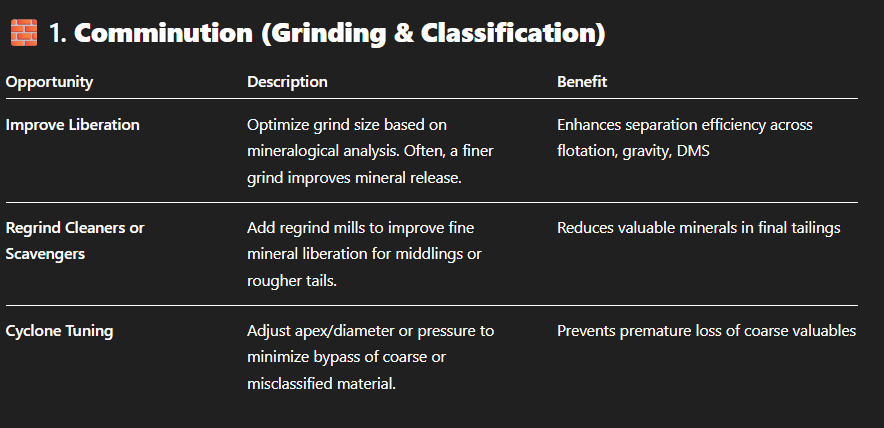
1. **Improve liberation** – Finer grind or targeted regrind to release locked particles
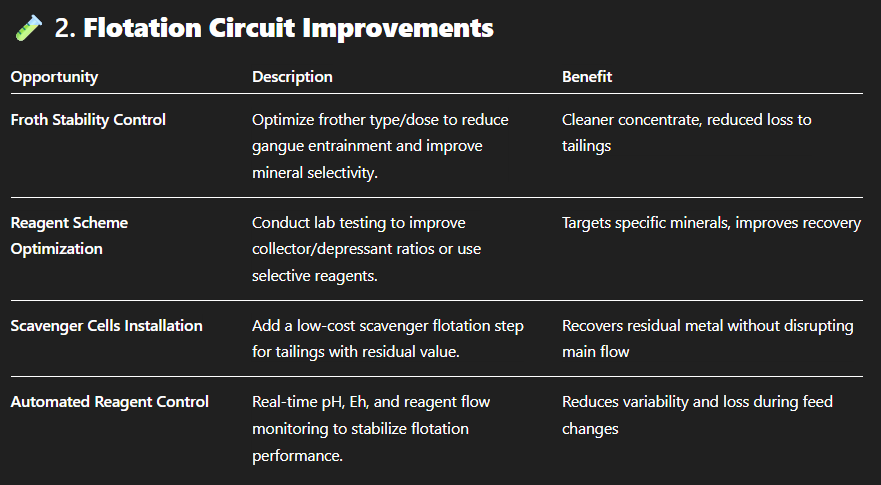
2. **Enhance reagent schemes** – Adjust collector/frother/selectivity for finer or more complex minerals
3. **Add scavenger stages** – Re-float or re-process tailings with low capital cost
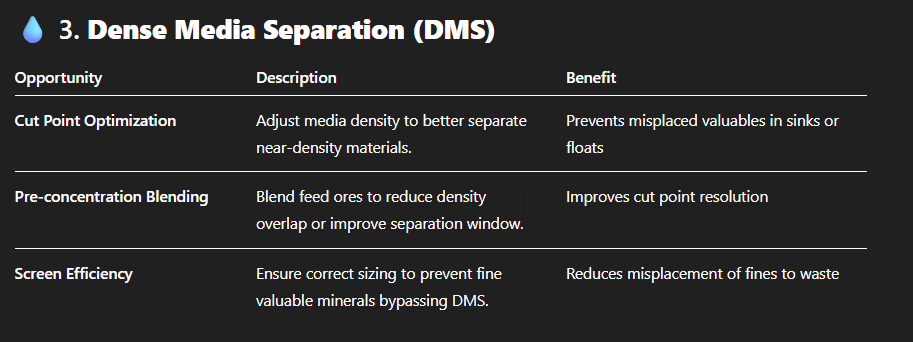
4. **DMS tuning** – Adjust cut-point density to reduce misplacement of valuables to sinks
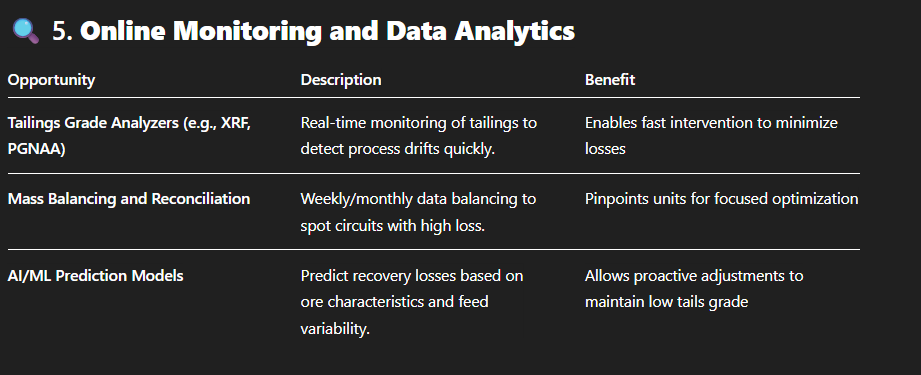
5. **Install online analyzers** – Enable real-time tailings grade feedback to operations
6. **Blend feed material** – Avoid spikes in tailings grade from high-variability ores
---
### 

Why Tailings Grade Matters
 **Why Tailings Grade Matters in Mineral Processing**
Tailings Grade (%) is one of the most **critical KPIs** in evaluating the **efficiency** and **economic performance** of a mineral processing plant. While throughput and recovery tell you how much you’re producing, **tailings grade tells you how much you’re losing**.
---
## 
Every tonne of metal in the tailings stream is a **lost revenue opportunity**:
* A gold plant discharging tailings at 0.5 g/t instead of 0.2 g/t may lose **millions of dollars annually**.
* In base metal operations, even a 0.1% increase in tailings Cu grade can result in **significant concentrate revenue loss**.

---
## 
* Poor liberation (grinding too coarse)
* Incorrect reagent dosage or chemistry
* Ineffective flotation, DMS, or magnetic separation settings
* Cyclone bypass or misclassification

---
## 
* **Metal recovery**
* **Mass balance closure**
* **Loss diagnostics** across circuits Without accurate tailings data, you can’t **trust your recovery numbers**.
---
## 
* Increases the **future liability** if metals become re-processable
* Can affect **tailings dam design**, since tailings may require additional handling
* May attract **regulatory attention** or scrutiny in public disclosures

---
## 
* Justify **scavenger circuits**, **regrind mills**, or **tailings retreatment plants**
* Highlight areas where **cost-effective recovery improvements** are possible
* Help **prioritize process audits and test work**
---
### 
> **Tailings grade is the flip side of recovery — and just as important.** Tracking, analyzing, and minimizing tailings grade is essential to **maximizing metal yield**, reducing losses, and improving the overall **technical and financial health** of a mineral processing operation.
Tailings Grade Optimization opportunities
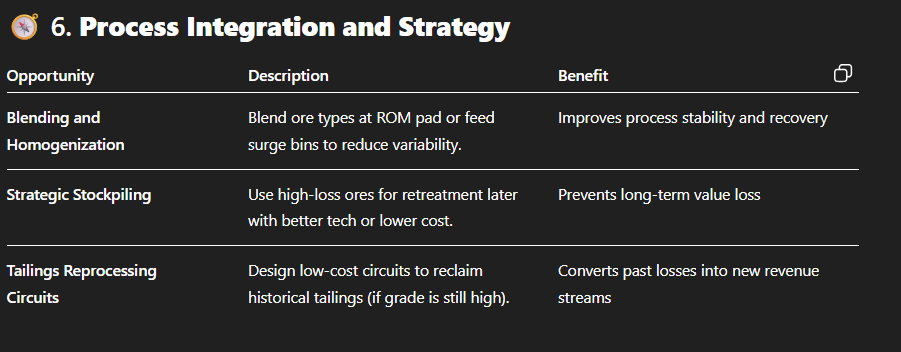
 **Optimization Opportunities for Reducing Tailings Grade**
Reducing tailings grade improves metal recovery, enhances profitability, and reduces environmental liability. Below are targeted optimization opportunities, organized by process area and loss mechanism:
---
## 
---
## 
---
## 
---
## 

---
## 
---
## 
---
### 

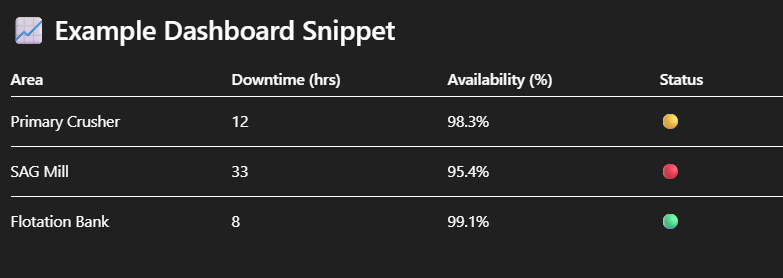
Unscheduled Downtime
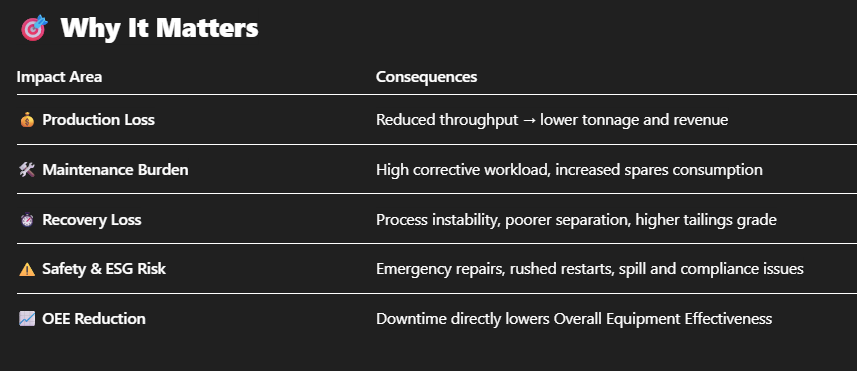
 **Unscheduled Downtime (hours/month) – KPI Overview**
**KPI Name**: **Unscheduled Downtime**
**Units**: Hours per month (or % availability lost)
**Category**: Equipment Availability and Reliability KPI
**Applies To**: All process units — crushers, mills, screens, pumps, flotation cells, DMS circuits, conveyors, thickeners, etc.
---
## 
**Unscheduled Downtime** measures the total number of **unexpected hours per month** when equipment is not available for operation due to:
* Mechanical breakdowns
* Electrical/control failures
* Instrumentation malfunctions
* Unplanned maintenance or operator errors > It reflects **operational disruptions**, not including planned shutdowns or maintenance.
---
## 
---
## 

---
## 
---
## 
---
## 
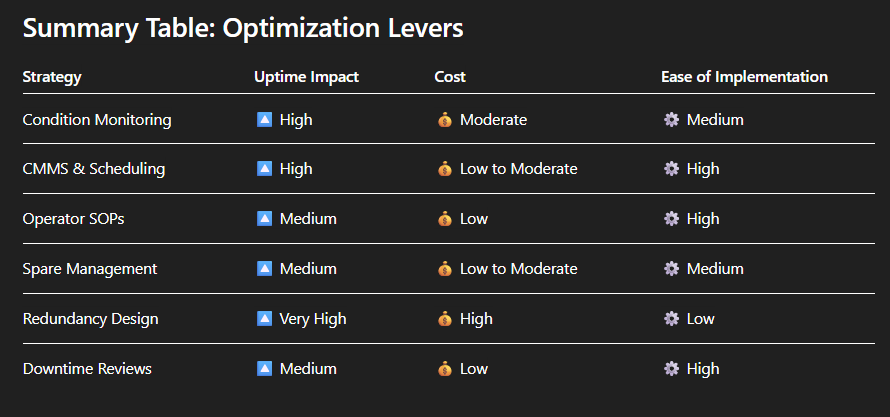
1. **Condition Monitoring (Vibration, Thermography, Oil)** → Detect early signs of failure
2. **Digital Maintenance Systems (CMMS/EAM)** → Schedule preventive work and analyze failure trends
3. **Root Cause Failure Analysis (RCFA)** → Eliminate repeat breakdowns at the source
4. **Spare Parts Strategy** → Ensure critical spares are in stock for fast turnaround
5. **Operator Training & SOPs** → Reduce failures due to human error or incorrect startups
6. **Redundancy for Critical Systems** → Parallel pumps, standby conveyors, backup generators
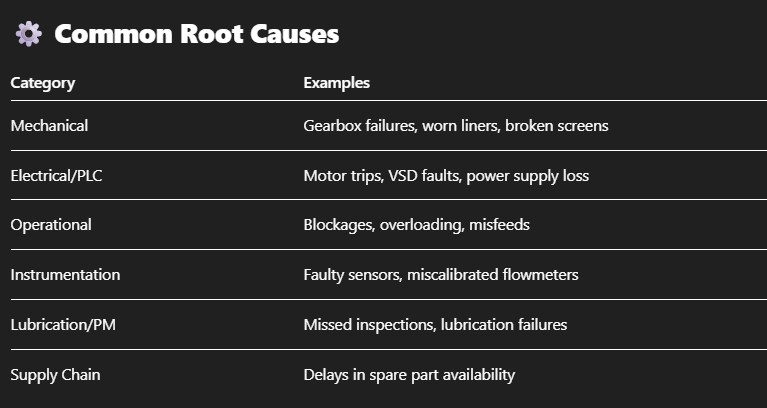
Unscheduled Down Time - Common roots Causes
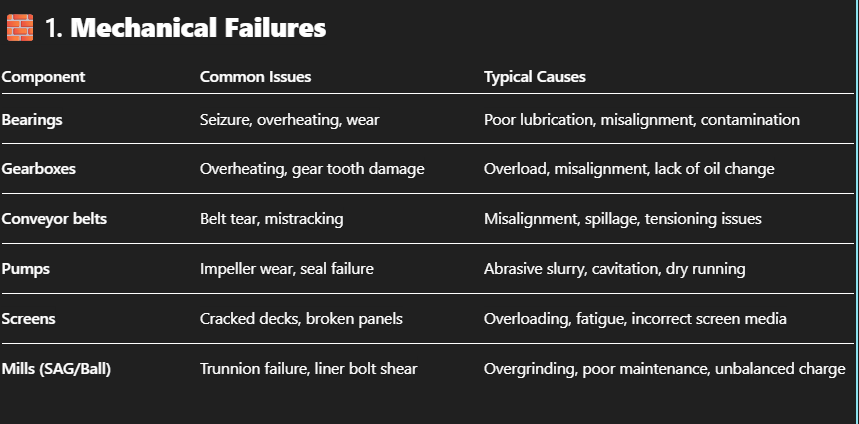
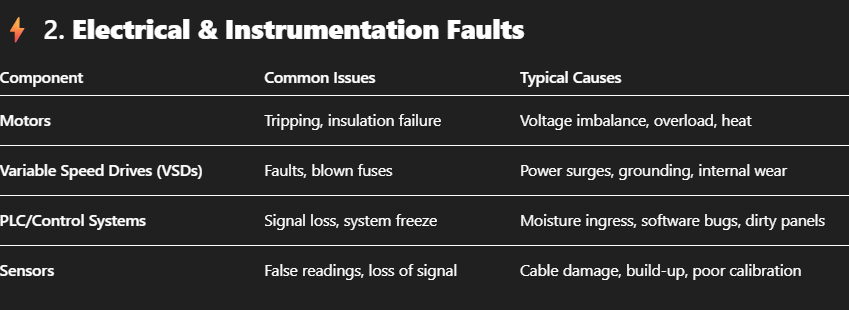
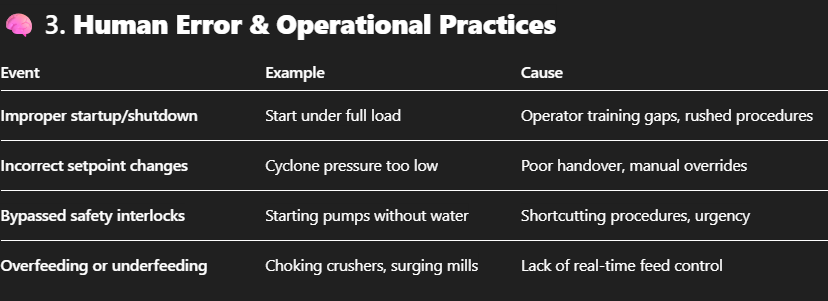
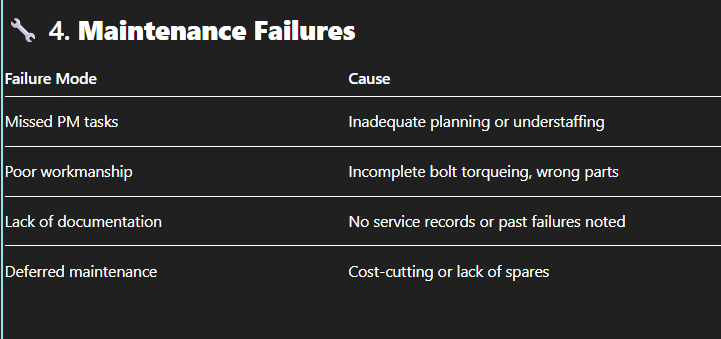
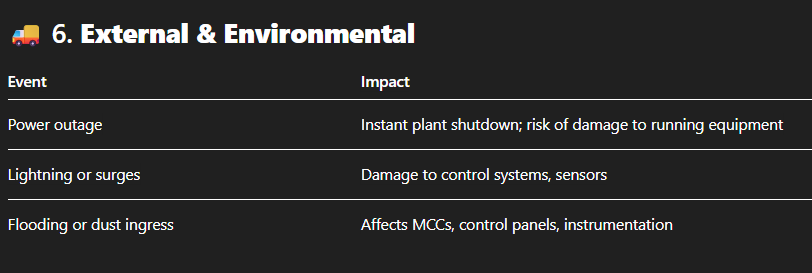
 **Common Root Causes of Unscheduled Downtime in Mineral Processing Plants**
Unscheduled downtime is a major source of lost production and increased maintenance costs. Below is a structured breakdown of **frequent root causes** by category, specifically in the context of mineral processing operations (crushing, grinding, classification, separation, dewatering, etc.).
---
## 
---
## 
---
## 
---
## 
---
## 

---
## 
---
### 
1. **Pump failure due to slurry abrasion or dry running**
2. **Conveyor belt breakdown due to mistracking or roller failure**
3. **Motor trip from overload or electrical imbalance**
4. **Screen panel damage leading to shutdowns**
5. **Control system communication loss or sensor drift**
Unscheduled Down Time Optimization Opportunities
 **Optimization Opportunities to Reduce Unscheduled Downtime**
Reducing unscheduled downtime is one of the fastest ways to **increase plant availability, throughput, and profitability**.
Below are proven **strategic and tactical opportunities** to optimize uptime in mineral processing plants.
---
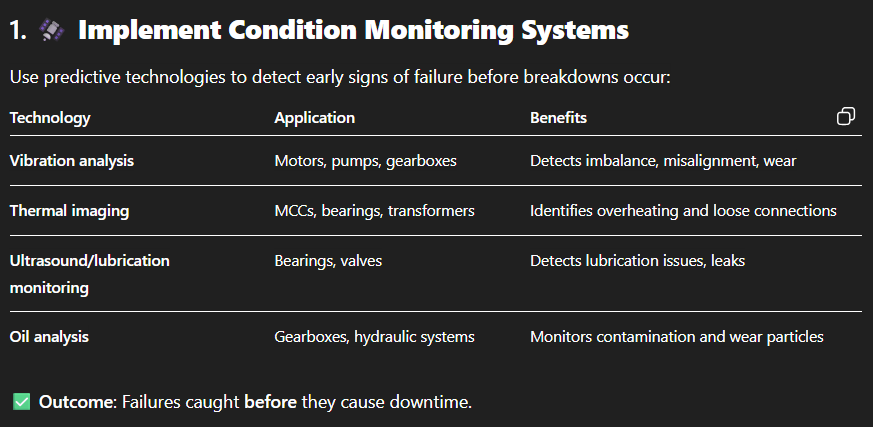
## 1. 
Use predictive technologies to detect early signs of failure before breakdowns occur:
---
## 2. 
* **Computerized Maintenance Management Systems (CMMS)** for scheduling and tracking
* **Failure history tracking** and trend analysis
* **Criticality-based maintenance planning** (focus on highest-risk assets)
* **KPI dashboards** to flag deteriorating asset conditions

---
## 3. 
Untrained or inconsistent operator actions can trigger avoidable breakdowns:
* Create and enforce **standard operating procedures (SOPs)** for startups, shutdowns, and emergency conditions.
* Run **routine operator training** with checklists, control room simulations, and shadowing.
* Empower operators to identify early signs of failure (e.g., pump noise, motor amps, screen vibration).

---
## 4. 
* Classifying **critical spares** (long lead time + high impact)
* Maintaining minimum stock levels for wear components
* Using **parts kitting** for shutdown readiness
* Digitizing inventory and linking to maintenance scheduling

---
## 5. 
* Add **redundant pumps**, conveyors, or power lines for continuous operation
* Design layouts for **easier access** during repairs (e.g., swing-out motors, quick-change screens)
* Use **modular components** to reduce mean time to repair (MTTR)

---
## 6. 
* **Weekly downtime analysis meetings** (top 5 events + action plans)
* Use of **Root Cause Analysis (RCA)** tools for repeated failures
* **Downtime tagging** in SCADA or historian systems for automatic tracking
* Creating a **"bad actor" equipment list** for focused improvements

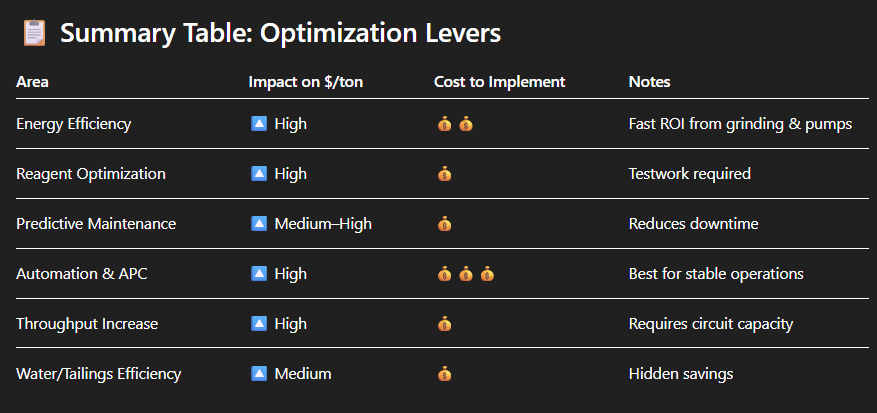
--- ## Summary Table: Optimization Levers
Cost Per ton Processed
 **Cost per Ton Processed (\$/ton)**
**Definition**:
The **Cost per Ton Processed** measures the **total operational cost** incurred to process **one ton of ore** through the plant.
**Cost per Ton Processed (\$/ton)**
**Definition**:
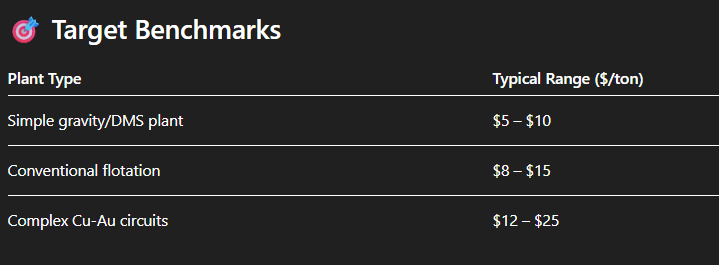
The **Cost per Ton Processed** measures the **total operational cost** incurred to process **one ton of ore** through the plant.It is a critical performance indicator for evaluating **efficiency, profitability, and competitiveness** of a mineral processing operation.
---
## 
---
## 
---
## 
---
## 

---
## 

* Energy-efficient equipment
* Load shifting
* Improved grinding/classification efficiency

* Real-time dosing control
* Reagent selection or blending

* Predictive maintenance
* Spares optimization
* Faster changeout strategies

* Feed stability and blending
* Flow control, softer liners, wear-resistant materials
Reducing Cost Per Ton
 **Optimization Opportunities: Reducing Cost per Ton Processed (\$/ton)**
Reducing the **cost per ton processed** is a powerful lever to boost profitability—especially when commodity prices fluctuate. Optimization should focus on **energy, consumables, labor, equipment efficiency**, and **process stability**.
---
## 
* Upgrade to **high-efficiency motors, pumps, and drives**
* Install **Variable Frequency Drives (VFDs)** on pumps, conveyors, fans
* **Optimize grinding circuit efficiency** (e.g., mill charge control, media size, cyclone performance)
* Introduce **load shifting** to off-peak tariff times
* Recover waste heat (especially in smelting or drying)


---
## 
* **Automate reagent dosing** based on real-time pH, Eh, ORP, or froth stability
* **Conduct lab-scale trials** for alternative, lower-cost reagents or blends
* Optimize **flocculant dosage** in thickening
* Prevent **overgrinding** that increases reagent demand


---
## 
**Opportunities:**
* Implement **predictive maintenance** (vibration, oil, thermography)
* Use **condition-based spares planning**
* Switch to **modular wear components** for quicker replacement
* Track and eliminate **bad actor equipment**


---
## 
**Opportunities:**
* Automate **grinding mill load control** (e.g., power draw + sound sensors)
* Real-time **density and flow control** in DMS/hydrocyclones
* Stabilize flotation circuits using **AI-based air and reagent feedback loops**
* Deploy **soft sensors** and ML algorithms for predictive optimization


---
## 
**Opportunities:**
* Eliminate **bottlenecks** (e.g., pump upgrades, screen capacity, chute blockages)
* **Debottleneck conveyors or feeders**
* **Shorten changeover and downtime cycles**
* Blend ore more consistently to prevent circuit instability


---
## 
**Opportunities:**
* Improve **thickener performance** to reduce water demand
* Recycle process water to reduce fresh intake
* Optimize **tailings pumping and pipe wear** to reduce maintenance


---
## 
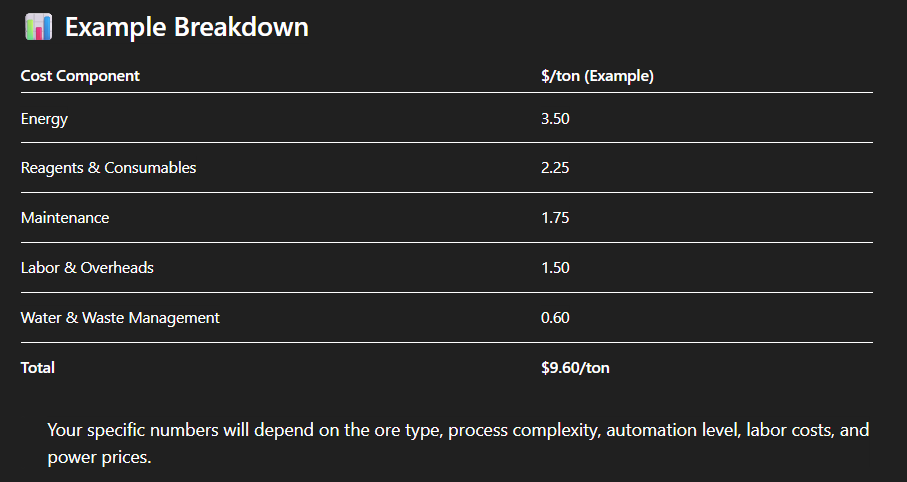
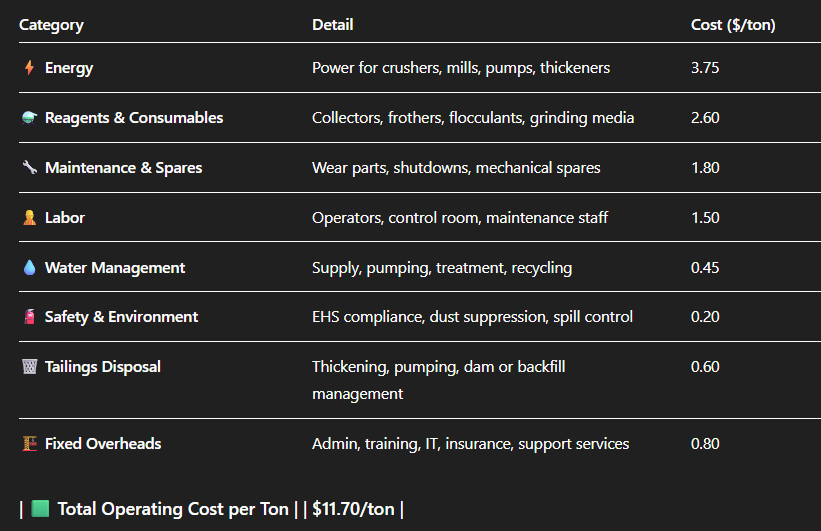
Example : Cost per Ton Breakdown
---
### 
---
### 
---
### 
* **Energy** costs vary significantly based on grinding circuit type (e.g., SAG vs HPGR vs Ball mill).
* **Reagent** consumption depends on ore mineralogy, liberation size, and recovery targets.
* **Tailings** and **water** costs can rise with strict environmental requirements or remote locations.
* **Labor** cost intensity increases with low automation or multi-shift staffing models.
Energy Eficiency in Mineral Processing Plants
 **Energy Efficiency in Mineral Processing Plants**
Energy typically represents **30–60% of total operating costs** in mineral processing, especially in comminution (crushing, grinding) and pumping systems. Improving energy efficiency directly reduces the **cost per ton** and can also enhance throughput and equipment life.
---
### 
* **Grinding circuits** alone can consume over **50% of a plant’s power**.
* Every **1% improvement in mill efficiency** can equate to **thousands of dollars saved daily**.
* Energy inefficiency often leads to **overgrinding**, excess wear, and poor product size control.
---
## 
### 1. 
* Use **real-time load and power control** (e.g., mill sound, power draw, weight sensors)
* Optimize **media size and charge volume** to reduce overgrinding
* **Convert from ball mills to HPGRs** where ore is suitable
* Install **grate discharge** instead of overflow mills for higher efficiency

---
### 2. 
* Upgrade to **high-efficiency screens** or multi-deck setups
* Monitor and reduce **recirculating loads** to avoid excess grinding

---
### 3. 
* Switch from **jaw to cone crushers** for secondary/tertiary crushing
* Optimize **choke feeding** and **crusher setpoints**
* Use **automated load sensing** to adjust feed rates dynamically

---
### 4. 
* Replace aging motors with **high-efficiency (IE3/IE4) models**
* Use **Variable Frequency Drives (VFDs)** on pumps, fans, conveyors
* Implement **soft starters** and power factor correction

---
### 5. 
* Optimize **pump sizing** to match duty cycles
* Use **correctly designed pipework** to minimize friction losses
* Reuse process water near the source to **shorten pumping distances**

---
### 6. 
* Install **sub-metering** at each major unit (mill, crusher, pump)
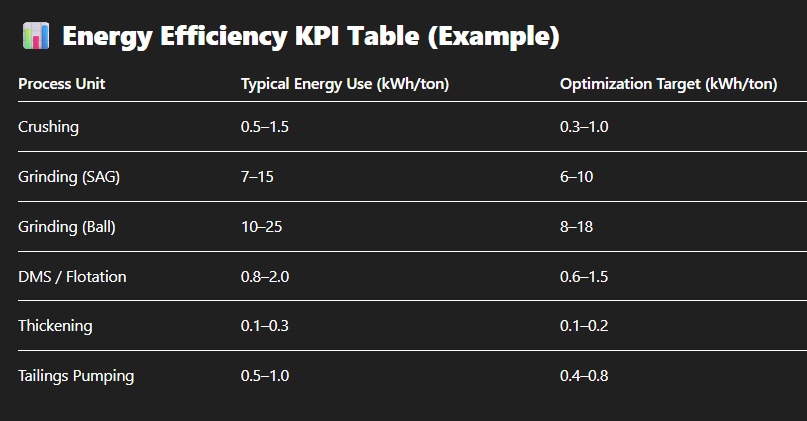
* Set up **energy KPIs** (e.g., kWh/ton per process unit)
* Benchmark shifts, crews, and circuits to highlight performance gaps

---
## 
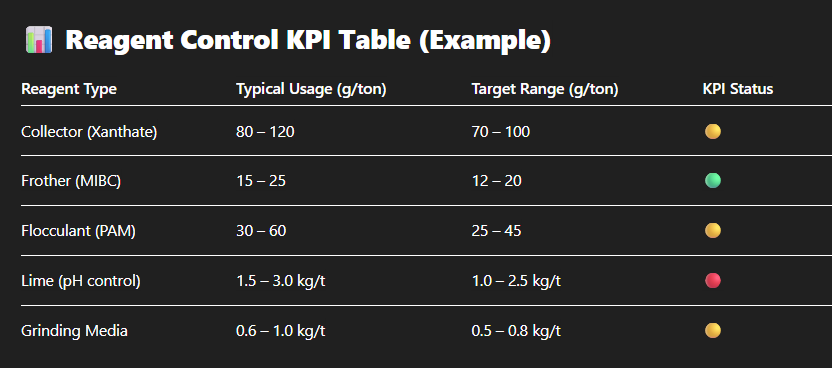
Reagent and Consumable Control
 **Reagent and Consumable Control in Mineral Processing Plants**
Controlling reagent and consumable usage is essential for cost efficiency, metallurgical performance, and environmental compliance.
Reagents (e.g., collectors, frothers, flocculants) and consumables (e.g., grinding media, filter cloths) are often among the **top three variable costs** in a plant.
---
## 
* 
* 
* 
* 
---
## 
### 1. 
* Use **online pH, ORP, and conductivity meters** to dynamically control reagent pumps
* Link dosing to **real-time process indicators** (e.g., feed rate, solid %)
* Use **mass flow controllers** for precision

---
### 2. 
* Conduct **split-circuit A/B tests** to assess new reagent blends or dosages
* Adjust based on:
* Mineral liberation
* Sulfide vs oxide balance
* Water chemistry (salinity, hardness, pH)

Lab-scale flotation, XRF assays, plant surveys
---
### 3. 
* Monitor **grinding media wear rate** (kg/t) vs tonnage and power draw
* Use **wear-resistant materials** in high-impact zones (mill liners, pump parts)
* Track **filter cloth life**, screen panel replacements, flocculant performance

---
### 4. 
* Create **per-unit usage KPIs**:
* Frother consumption (g/ton)
* Collector consumption (g/ton)
* Flocculant dose (g/m³ or g/t of solids)
* Benchmark **cost/ton** across shifts, ore types, and circuit configurations

---
### 5. 
* Avoid **stockouts** or **overstocking** by implementing:
* Just-in-time delivery contracts
* Minimum stock level alarms
* Usage rate forecasting

---
## 
---
## 
* Switch to **hybrid or customized reagents**
* Use **AI-based dosage controllers** (adaptive to ore variability)
* Implement **operator training programs** focused on froth visibility, reagent behavior
* Set up **monthly reagent performance reviews**
Maintenance Strategy Optimizatiobn
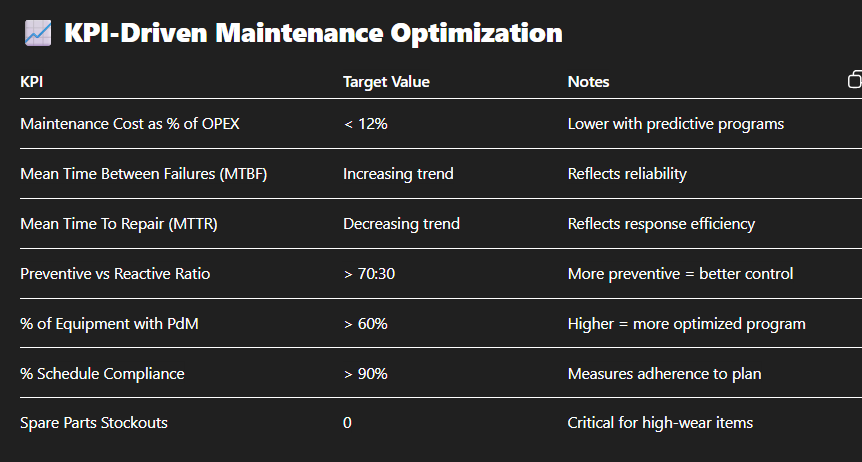
 **Maintenance Strategy Optimization for Mineral Processing Plants**
Optimizing your maintenance strategy can significantly reduce downtime, extend equipment life, and cut operational costs — especially in high-wear, high-capex circuits like **crushing, grinding, flotation**, and **dewatering**.
---
## 
* 
* 
* 
---
## 
### 1. 
* Scheduled based on **OEM guidelines**, run hours, or tonnage.
* Suitable for predictable wear components (belts, screens, pumps).

---
### 2. 
* Uses **sensor data** to monitor machine health in real-time:
* Vibration
* Temperature
* Oil analysis
* Motor current
* Triggers maintenance **before failure**, reducing unplanned stoppages.

---
### 3. 

* Maintenance based on actual **measured condition**, not time.
* Combines **visual inspections**, manual readings, and sensor data.

---
### 4. 
* Train operators to:
* Detect early faults (noise, vibration, leaks)
* Perform basic upkeep (lubrication, bolt checks)
* Record observations digitally

---
### 5. 
* Track:
* Work orders
* Inventory
* Technician performance
* Maintenance cost per unit
* Integrate with SCADA and ERP for full visibility.

---
## 
---
## 
* Implement **predictive tools on critical equipment** (e.g., SAG mill motors, flotation blowers)
* Shift from **time-based to condition-based scheduling**
* Prioritize **root cause failure analysis (RCFA)** after major failures
* Run **maintenance planning workshops** with ops and engineering
* Set up **tiered intervention protocols**: daily, weekly, monthly, quarterly
Process Stabilization and Automation
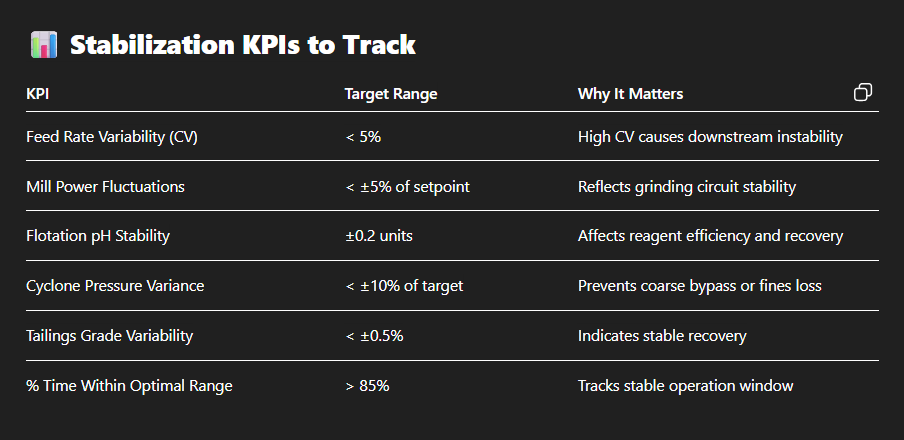
 **Process Stabilization and Automation in Mineral Processing Plants**
In modern mineral processing, **process stability and automation** are no longer optional — they are key to maximizing **recovery, throughput, energy efficiency, and cost control**.
**Process Stabilization and Automation in Mineral Processing Plants**
In modern mineral processing, **process stability and automation** are no longer optional — they are key to maximizing **recovery, throughput, energy efficiency, and cost control**.Variability in feed, human error, and delayed response can all cause instability that drives losses across circuits.
---
## 
* 
* 
* 
---
## 
### 1. **Instrumentation & Sensing**
* Use **high-frequency sensors** to track:
* Feed rate, density, particle size (e.g., PSI, VisioRock)
* pH, ORP, DO in flotation
* Cyclone pressure, underflow density
* Vibration, acoustic signals (mills)

--- ### 2. **Control Systems**
* **PID Loops**: Maintain stable levels, pressures, and flow rates
* **Fuzzy Logic**: Used for systems with non-linear response (e.g., flotation level control)
* **Model Predictive Control (MPC)**:
* Predicts future process behavior
* Adjusts variables proactively
* Ideal for grinding and flotation

--- ### 3. **Advanced Process Control (APC)**
* Layered on top of SCADA/PLC
* Integrates multiple inputs:
* Ore hardness * Pulp chemistry
* Particle size
* Optimizes setpoints dynamically (e.g., SAG mill speed, flotation air rate)

--- ### 4. **Operator Guidance and Automation Dashboards**
* Real-time dashboards with **traffic-light indicators** for:
* Circuit balance
* Stability metrics (CV, oscillation, lag)
* Critical KPIs (pH, % solids, recovery)

---
## 
---
## 
* 
* 
* 
* 
* 
Throughput Maximization
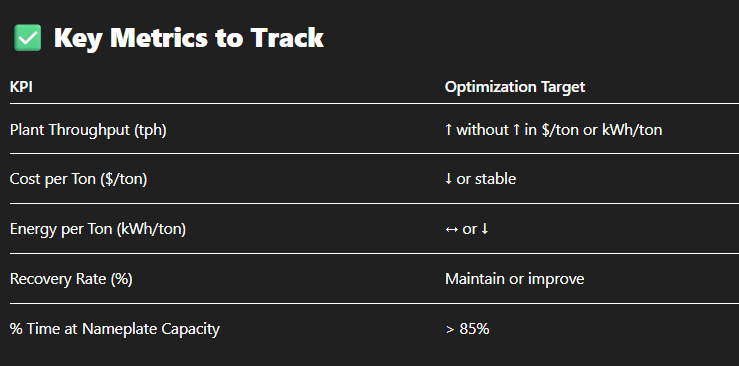
 **Throughput Maximization Without Proportional Cost Increase**
(“More tons, less cost per ton”)
Increasing throughput without proportionally increasing cost is a **cornerstone goal** for mineral processing plants seeking operational excellence. It's not just about pushing more tons — it's about doing so **intelligently**, where **efficiency gains offset additional inputs**.
---
## 
* 
* 
* 
---
## 
### 1. 
* Identify unit operations (e.g., crushers, pumps, cyclones) limiting flow.
* Upgrade specific chokepoints (not entire systems).

---
### 2. 
* Throughput increases must follow **process stabilization** (low CV, tight control loops).
* A stable system resists surges, avoids overloads, and reduces overcorrection.

---
### 3. 
* Advanced Process Control (APC) or AI-driven systems:
* Optimize grinding load and speed.
* Maintain flotation balance while increasing feed.
* Adjust automatically for **ore hardness or density changes**.

---
### 4. 
* Improve **maintenance planning** to reduce time-based losses.
* Introduce **modular spares** or fast-swap components (e.g., pumps, screens).

*
---
### 5. 
* Retrofit **VSDs** on conveyors, pumps, and fans.
* Optimize **grind size** to avoid overgrinding (saves energy & boosts throughput).

---
### 6. 
* Control % solids to ensure optimal cyclone separation and flotation.
* Recycle water more efficiently to reduce pumping costs and dilution risks.

---
### 7. 
* Blend for consistent hardness, mineralogy, and moisture.
* Reduce the impact of hard or sticky ore that slows down crushers and mills.

---
## 
---
## 
Water and Tailings Efficiency

 **Water and Tailings Efficiency in Mineral Processing**
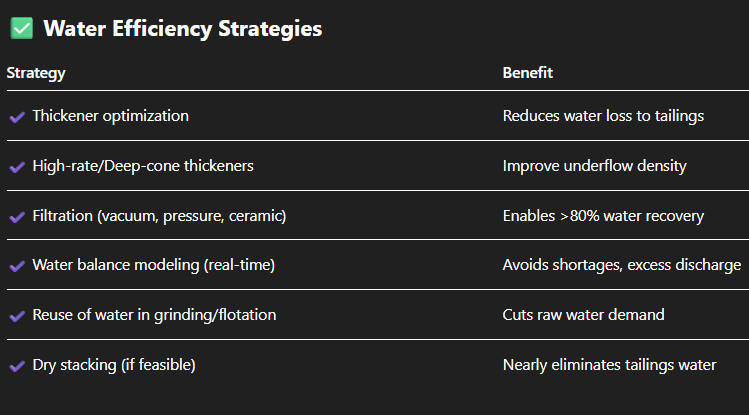
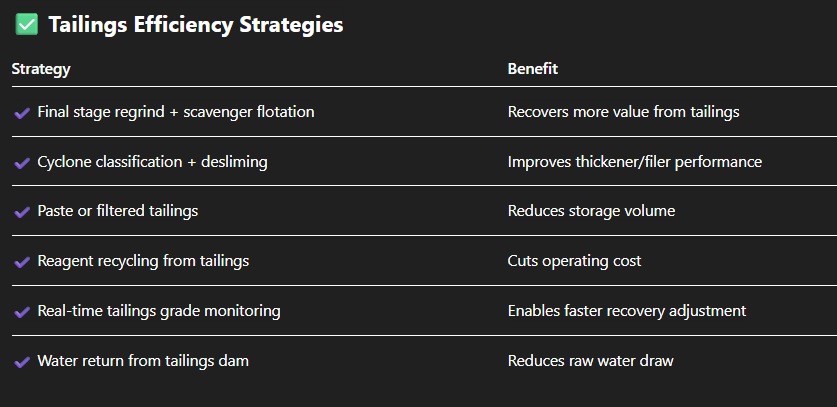
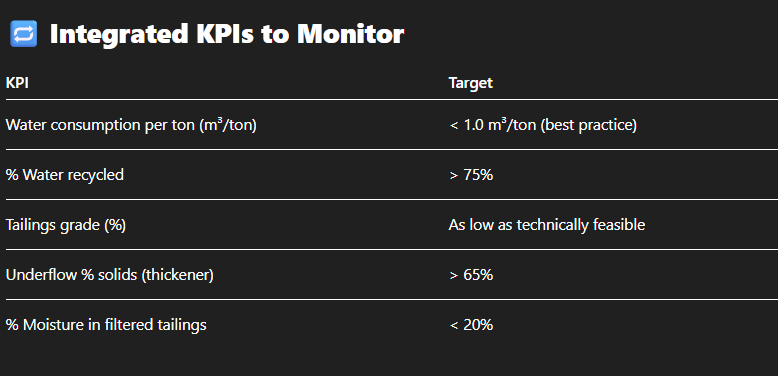
Improving **water and tailings efficiency** is critical for both **operational sustainability** and **regulatory compliance**. These areas also hold significant potential for **cost savings**, **resource recovery**, and **environmental impact reduction** when optimized together.
---
## 
### 
* Mining uses **3–5 m³ of water per ton** of ore in some operations.
* Regulatory pressure is growing around **zero discharge** and **freshwater withdrawals**.
* High water use increases **pumping, treatment, and reagent costs**.
---
### 
---
## 
### 
* Tailings can contain **2–10% of unrecovered metal**, depending on separation performance.
* Higher moisture = higher **volume, storage cost**, and **failure risk**.
* Tailings quality impacts **long-term closure and liability costs**.
---
### 
---
## 
---
## 
* Implement **dynamic water balance software**
* Introduce **real-time tailings grade analyzers**
* Apply **AI-based thickener control**
* Evaluate **reprocessing tailings with high residual metal**
